Diagrams
Big-ACL provides several diagram types to help you visualize your authorization model and understand relationships between entities, principals, resources, and actions.
Available Diagram Types
Section titled “Available Diagram Types”| Diagram | Purpose | Access |
|---|---|---|
| Entity Diagram | Visualize your data model with entity relationships | Entities > Diagram view |
| Cedar Schema Diagram | Visualize the authorization model (principals, resources, actions) | Diagrams > Cedar |
| Context Canvas | Interactive diagram for mapping business relationships | Diagrams > Canvas |
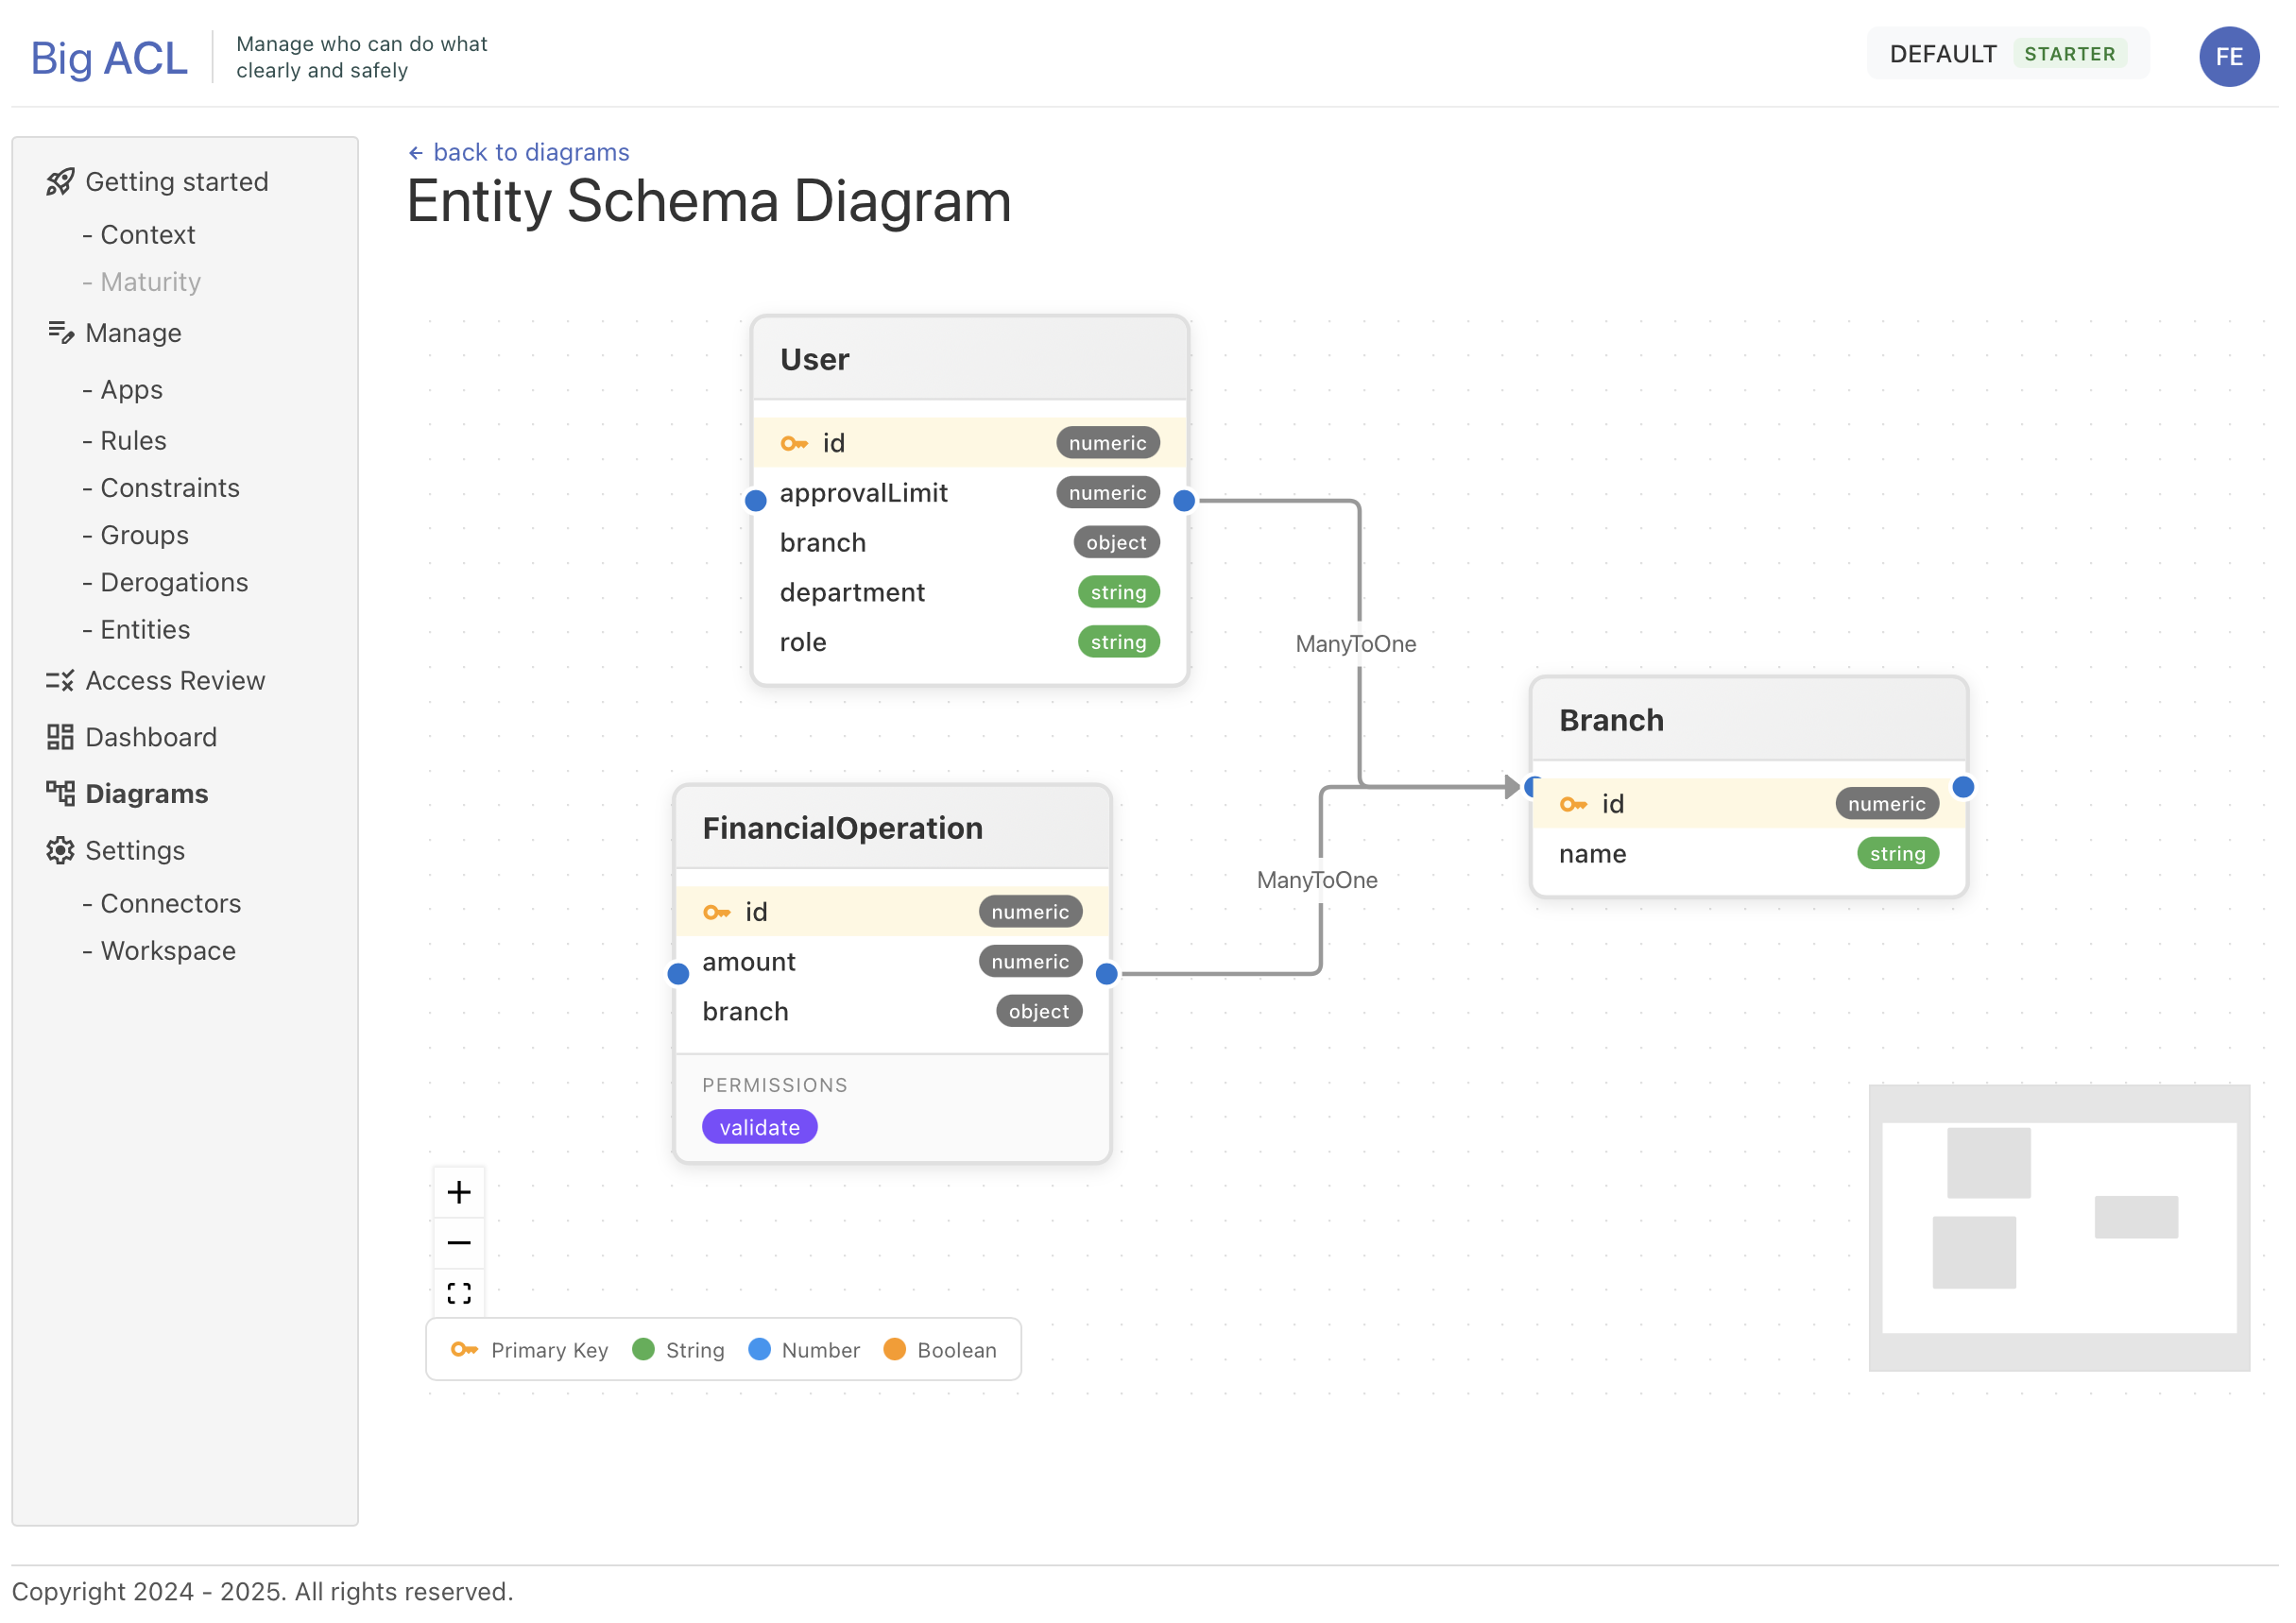
Entity Diagram
Section titled “Entity Diagram”The Entity Diagram provides a visual representation of your complete data model.
What It Shows
Section titled “What It Shows”- All entity types defined in your system
- Entity attributes/fields with their names and types
- Primary keys (highlighted with a key icon)
- Relationships between entities with cardinality labels
- Permissions associated with each entity
Accessing the Diagram
Section titled “Accessing the Diagram”- Navigate to Entities
- Click the Diagram toggle button (schema icon)
Alternatively, access it from Diagrams > Schema.
Node Display
Section titled “Node Display”Each entity is represented as a card containing:
| Section | Content |
|---|---|
| Header | Entity name |
| Fields | List of properties with type badges |
| Primary Key | Marked with a key icon, displayed first |
| Permissions | Purple badges showing available actions |
Field Type Colors
Section titled “Field Type Colors”| Color | Type |
|---|---|
| Green | String |
| Blue | Numeric (number, integer, long) |
| Orange | Boolean |
| Purple | Date / DateTime |
| Gray | Entity reference |
Relationships
Section titled “Relationships”- Arrows connect entities that have relationships
- Labels on arrows indicate the relationship name or cardinality
- Supports one-to-many and many-to-many relationships
Cedar Schema Diagram
Section titled “Cedar Schema Diagram”The Cedar Schema Diagram visualizes your authorization structure based on the Cedar policy language model.

What It Shows
Section titled “What It Shows”- Principals (blue): Entities that can perform actions (subjects/actors)
- Resources (orange): Entities that can be accessed
- Actions: Operations that principals can perform on resources
- Arrows showing which principals can act on which resources
Accessing the Diagram
Section titled “Accessing the Diagram”Navigate to Diagrams > Cedar.
Node Types
Section titled “Node Types”| Node Color | Role | Description |
|---|---|---|
| Light blue | Principal | Who can perform actions (e.g., User, Admin) |
| Light orange | Resource | What can be accessed (e.g., Document, Project) |
| Light gray | Both | Entity used as both principal and resource |
Node Content
Section titled “Node Content”Each node displays:
- Entity name in the header
- Attributes with their types in the middle section
- Actions (for resources) as gray badges at the bottom
Understanding Arrows
Section titled “Understanding Arrows”Arrows represent authorization relationships:
- Source: Principal entity (who)
- Target: Resource entity (what)
- Label: Action name(s) that can be performed
Example: An arrow from User to Document labeled read, write means users can read and write documents.
Legend
Section titled “Legend”A legend is displayed at the bottom-left corner:
- Blue square = Principal (Subject)
- Orange square = Resource
- Arrow = Action relationship
Context Canvas
Section titled “Context Canvas”The Context Canvas is an interactive diagram for mapping people, applications, data, and organizational relationships.
What It Shows
Section titled “What It Shows”- Business actors and their roles
- Applications in your ecosystem
- Data assets
- Organizational structures
- Semantic relationships between all these elements
Accessing the Canvas
Section titled “Accessing the Canvas”Navigate to Diagrams > Canvas.
Entity Types
Section titled “Entity Types”| Type | Color | Icon | Description |
|---|---|---|---|
| Profile/Role | Blue | Person | Users, roles, or personas |
| Data | Green | Database | Data assets or datasets |
| Application | Purple | App | Software applications |
| Organization | Orange | Building | Organizational units |
Adding Entities
Section titled “Adding Entities”- Click the corresponding button in the left sidebar:
- Profile/Role for people or roles
- Data for data assets
- Application for applications
- Organization for organizational units
- A new node appears on the canvas
- Drag it to the desired position
Editing Entities
Section titled “Editing Entities”- Click on a node to select it
- The properties panel appears on the right sidebar
- Edit the Name field
- For Data nodes: toggle available actions (Read, Update, Validate, Delete)
- Changes are saved automatically
Creating Connections
Section titled “Creating Connections”- Drag from one node’s connection handle to another node
- A popup appears with relationship type options
- Select the appropriate relationship
- The connection is created and saved automatically
Relationship Types
Section titled “Relationship Types”Relationship options are context-aware based on the connected entity types:
| Connection | Example Relationships |
|---|---|
| Application → Data | Reads, Creates, Updates, Deletes, Exports, Imports |
| Person → Organization | Belongs to, Manages, Leads, Reports to |
| Person → Application | Uses, Administers, Supports |
| Application → Application | Integrates with, Calls, Depends on |
Deleting Elements
Section titled “Deleting Elements”- Click on a node or edge to select it
- Press the Delete key
- The element is removed and changes are saved automatically
Persistence
Section titled “Persistence”- All changes are automatically saved to browser storage
- Diagram state persists across sessions
- Data is stored per tenant
Navigation Controls
Section titled “Navigation Controls”All diagrams share common navigation controls powered by ReactFlow.
Toolbar Buttons
Section titled “Toolbar Buttons”| Button | Action |
|---|---|
| + | Zoom in |
| − | Zoom out |
| Fit | Fit all nodes in view with padding |
| Lock | Toggle interaction lock |
Mouse Controls
Section titled “Mouse Controls”| Action | Result |
|---|---|
| Scroll wheel | Zoom in/out |
| Click + drag background | Pan the viewport |
| Click node | Select node (Context Canvas shows properties) |
Mini-Map
Section titled “Mini-Map”- Located in the bottom-right corner
- Shows a miniature overview of the entire diagram
- Drag the viewport indicator to navigate
- Useful for large diagrams with many entities
Layout
Section titled “Layout”Automatic Layout (Entity & Cedar Diagrams)
Section titled “Automatic Layout (Entity & Cedar Diagrams)”Both the Entity Diagram and Cedar Schema Diagram use automatic layout:
- Direction: Left-to-right (LR)
- Algorithm: Dagre (directed graph layout)
- Node spacing: Automatically calculated to avoid overlaps
- Entities are positioned based on their relationships
Manual Layout (Context Canvas)
Section titled “Manual Layout (Context Canvas)”The Context Canvas uses manual positioning:
- Drag nodes to position them
- Positions are saved automatically
- New nodes appear in a grid pattern
Best Practices
Section titled “Best Practices”Reading the Entity Diagram
Section titled “Reading the Entity Diagram”- Start with your main entities (usually principals like User)
- Follow arrows to see what resources they relate to
- Check field types to understand data structure
- Look for primary keys to identify unique identifiers
- Review permissions to see available actions
Reading the Cedar Schema Diagram
Section titled “Reading the Cedar Schema Diagram”- Identify your principals (blue nodes) - these are your actors
- Identify your resources (orange nodes) - these are your protected assets
- Follow arrows to understand “who can do what to what”
- Read action labels to see specific permissions
- Use this view to validate your authorization model
Using the Context Canvas
Section titled “Using the Context Canvas”- Start by adding your main business actors (people/roles)
- Add the applications they interact with
- Add the data assets managed by those applications
- Connect elements with meaningful relationships
- Use the canvas to document and communicate your architecture